What are Graphs and Graphical Representation?
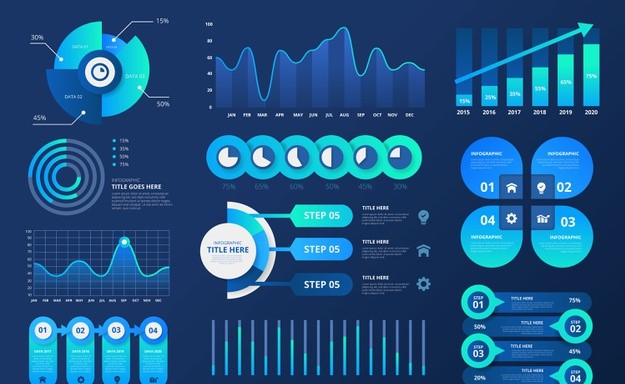
Graphs, in the context of data visualization, are visual representations of data using various graphical elements such as charts, graphs, and diagrams. Graphical representation of data, often referred to as graphical presentation or simply graphs which plays a crucial role in conveying information effectively.
Principles of Graphical Representation
Effective graphical representation follows certain fundamental principles that ensure clarity, accuracy, and usability:Clarity : The primary goal of any graph is to convey information clearly and concisely. Graphs should be designed in a way that allows the audience to quickly grasp the key points without confusion.
- Simplicity: Simplicity is key to effective data visualization. Extraneous details and unnecessary complexity should be avoided to prevent confusion and distraction.
- Relevance: Include only relevant information that contributes to the understanding of the data. Irrelevant or redundant elements can clutter the graph.
- Visualization: Select a graph type that is appropriate for the supplied data. Different graph formats, like bar charts, line graphs, and scatter plots, are appropriate for various sorts of data and relationships.
Rules for Graphical Representation of Data
Creating effective graphical representations of data requires adherence to certain rules:
- Select the Right Graph: Choosing the appropriate type of graph is essential. For example, bar charts are suitable for comparing categories, while line charts are better for showing trends over time.
- Label Axes Clearly: Axis labels should be descriptive and include units of measurement where applicable. Clear labeling ensures the audience understands the data’s context.
- Use Appropriate Colors: Colors can enhance understanding but should be used judiciously. Avoid overly complex color schemes and ensure that color choices are accessible to all viewers.
- Avoid Misleading Scaling: Scale axes appropriately to prevent exaggeration or distortion of data. Misleading scaling can lead to incorrect interpretations.
- Include Data Sources: Always provide the source of your data. This enhances transparency and credibility.
Importance of Graphical Representation of Data
Graphical representation of data in statistics is of paramount importance for several reasons:
- Enhances Understanding: Graphs simplify complex data, making it more accessible and understandable to a broad audience, regardless of their statistical expertise.
- Helps Decision-Making: Visual representations of data enable informed decision-making. Decision-makers can easily grasp trends and insights, leading to better choices.
- Engages the Audience: Graphs capture the audience’s attention more effectively than raw data. This engagement is particularly valuable when presenting findings or reports.
- Universal Language: Graphs serve as a universal language that transcends linguistic barriers. They can convey information to a global audience without the need for translation.
Advantages of Graphical Representation
The advantages of graphical representation of data extend to various aspects of communication and analysis:
- Clarity: Data is presented visually, improving clarity and reducing the likelihood of misinterpretation.
- Efficiency: Graphs enable the quick absorption of information. Key insights can be found in seconds, saving time and effort.
- Memorability: Visuals are more memorable than raw data. Audiences are more likely to retain information presented graphically.
- Problem-Solving: Graphs help in identifying and solving problems by revealing trends, correlations, and outliers that may require further investigation.
Use of Graphical Representations
Graphical representations find applications in a multitude of fields:
- Business: In the business world, graphs are used to illustrate financial data, track performance metrics, and present market trends. They are invaluable tools for strategic decision-making.
- Science: Scientists employ graphs to visualize experimental results, depict scientific phenomena, and communicate research findings to both colleagues and the general public.
- Education: Educators utilize graphs to teach students about data analysis, statistics, and scientific concepts. Graphs make learning more engaging and memorable.
- Journalism: Journalists rely on graphs to support their stories with data-driven evidence. Graphs make news articles more informative and impactful.
Types of Graphical Representation
There exists a diverse array of graphical representations, each suited to different data types and purposes. Common types include:
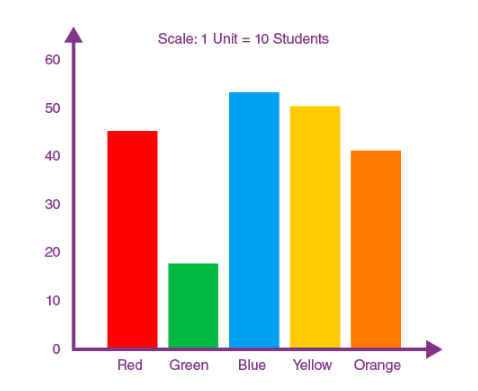
1.Bar Charts:
Used to compare categories or discrete data points, often side by side.
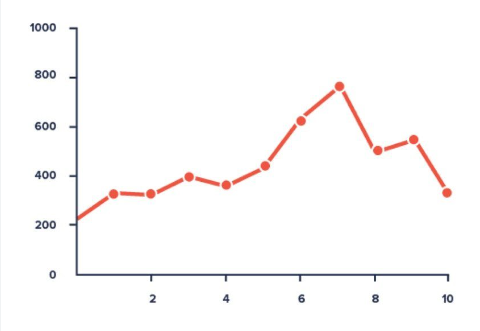
2. Line Charts:
Ideal for showing trends and changes over time, such as stock market performance or temperature fluctuations.
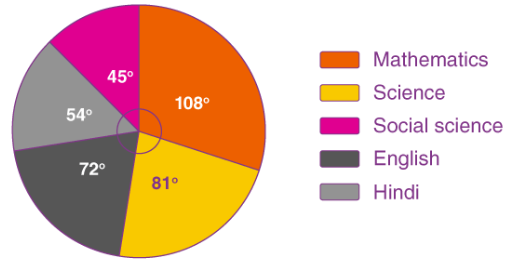
3. Pie Charts:
Display parts of a whole, useful for illustrating proportions or percentages.
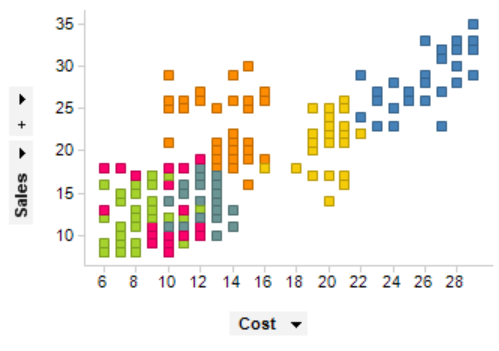
4. Scatter Plots:
Reveal relationships between two variables and help identify correlations.
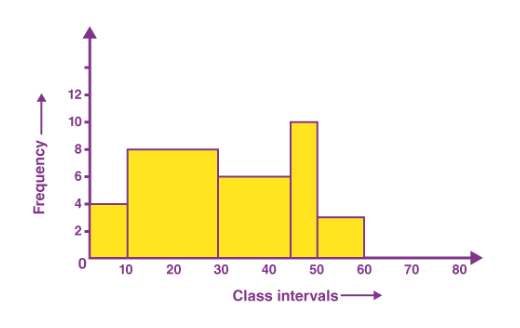
5. Histograms:
Depict the distribution of data, especially in the context of continuous variables.
Conclusion
In conclusion, the graphical representation of data is an indispensable tool for simplifying complex information, aiding in decision-making, and enhancing communication across diverse fields. By following the principles and rules of effective data visualization, individuals and organizations can harness the power of graphs to convey their messages, support their arguments, and drive informed actions.
Download PPT of Graphical Representation
Video On Graphical Representation
FAQs on Graphical Representation of Data
What is the purpose of graphical representation?
Graphical representation serves the purpose of simplifying complex data, making it more accessible and understandable through visual means.
Why are graphs and diagrams important?
Graphs and diagrams are crucial because they provide visual clarity, aiding in the comprehension and retention of information.
How do graphs help learning?
Graphs engage learners by presenting information visually, which enhances understanding and retention, particularly in educational settings.
Who uses graphs?
Professionals in various fields, including scientists, analysts, educators, and business leaders, use graphs to convey data effectively and support decision-making.
Where are graphs used in real life?
Graphs are used in real-life scenarios such as business reports, scientific research, news articles, and educational materials to make data more accessible and meaningful.
Why are graphs important in business?
In business, graphs are vital for analyzing financial data, tracking performance metrics, and making informed decisions, contributing to success.